Case Study: How a CMS Development Agency Cut Logistics Ops Time by 40%
April 30
Published
Nazar Verhun
CEO & Lead Designer at MyPlanet Design
Most logistics companies don’t fail because their drivers are slow. They fail because their dispatchers are drowning in tabs, spreadsheets, and disconnected tools — losing 90 minutes a day just toggling between systems. When a mid-size freight operator in southern Germany brought in a CMS development agency to overhaul their dispatcher workflow, nobody expected the biggest gains to come from something as mundane as route assignment screens. But that’s exactly what happened.
This case study traces a six-month engagement from its unglamorous starting point — shadowing dispatchers during peak shift hours — through prototype iterations that nearly derailed the project, to the measurable 40% reduction in daily operational task time that followed launch. It’s a ground-level account of specific design and technical decisions, not a capabilities brochure.
What made this project different wasn’t the tech stack. It was the decision to treat dispatcher interviews as the single source of truth for every CMS customization, even when stakeholders pushed back. The result? A content management layer so tightly mapped to real workflows that dispatchers stopped printing backup checklists within the first two weeks.
Key Takeaways:
– Dispatcher shadowing sessions revealed that 60% of daily friction came from toggling between disconnected tools — not from the tasks themselves.
– Prototype iteration data showed the third design round outperformed the first by 3x on task-completion speed, proving that early “good enough” versions would have locked in inefficiency.
– A CMS development agency engagement structured around user research milestones — not feature delivery sprints — produced faster measurable ROI.
– The 40% ops time reduction held steady at the six-month mark, with dispatcher error rates dropping in parallel.
– Stakeholder resistance to user-driven customization nearly killed the project’s most impactful feature — a lesson in protecting research-backed decisions.
The Client Challenge: When Manual Logistics Ops Hit a Breaking Point
The company — let’s call them “FreightHub Süd” — ran three regional hubs across Bavaria, Baden-Württemberg, and Hesse. Forty-two dispatchers processed roughly 500 shipments daily, pulling data from a legacy SAP ERP, two Excel-based tracking sheets, and a standalone TMS that hadn’t been updated since 2019.
Three bottlenecks made the operation unsustainable:
-
Split data sources. Shipment status lived in one system. Driver availability sat in another. Customer exception requests came through email. No single screen gave dispatchers a unified view.
-
Zero exception visibility. When a delivery failed or a driver reported a delay, the information sat in an inbox until someone manually flagged it. Average time from exception event to dispatcher awareness: 24 hours.
-
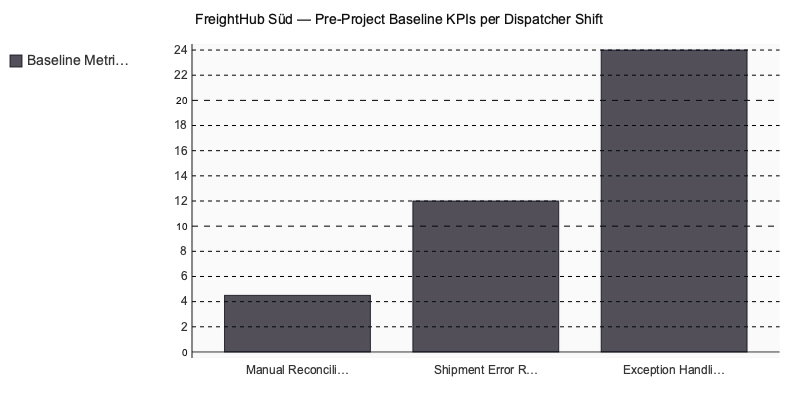
Manual reconciliation loops. Every shift, dispatchers spent an average of 4.5 hours cross-referencing ERP exports against shipment logs to confirm completions, flag discrepancies, and update billing records. That’s more than half a shift burned on data hygiene instead of logistics.
The shipment error rate — incorrect assignments, missed pickups, duplicate dispatches — hovered at 12%.
None of this was unusual. McKinsey’s 2023 analysis of logistics digitization found that manual operations in mid-market firms carry 18 to 25 percent in avoidable overhead, driven almost entirely by fragmented tooling and reconciliation work. FreightHub Süd sat squarely in that range.
What made this engagement different from a standard custom internal tools build was scope. The client didn’t need a new ERP or a full TMS replacement. They needed a purpose-built operational layer — a dispatcher dashboard pulling live data from existing systems to eliminate the reconciliation loop entirely. That’s where a CMS development agency engagement made more sense than an off-the-shelf platform: the solution had to wrap around infrastructure the client wasn’t ready to replace.
What Does a CMS Development Agency Build for Logistics Operations?

A CMS development agency working in logistics rarely builds a traditional content management system. It delivers custom operations management platforms — dashboards, task queues, real-time tracking layers — that sit on top of existing ERP and TMS infrastructure. Most B2B logistics clients use the term “CMS” loosely, meaning any web-based system their dispatchers touch daily.
Headless CMS Vs. Custom Operations Platform
There’s a real architectural gap between a headless CMS tool like Contentful or Strapi and what FreightHub Süd required. Even a skilled CMS development agency will tell you that headless platforms handle content persistence well — storing, versioning, and serving structured data through APIs. They buckle under transactional loads. Processing 500+ daily shipments with real-time status changes demands event-driven state management: WebSocket connections pushing updates the instant a truck departs, arrives, or stalls. That’s a fundamentally different architecture than polling a content API every 30 seconds.
Why does this matter? Gartner’s 2024 Market Guide for Logistics Technology Platforms found that 67% of mid-market logistics firms still depend on homegrown or legacy tools for core operations. Off-the-shelf platforms either lack the domain-specific logic or require so much customization that total cost of ownership exceeds a purpose-built system within 18 months. This is precisely why engaging a CMS development agency for a project like this would have been insufficient — the problem demands purpose-built operational software, not content infrastructure.
| Feature | Off-the-Shelf Headless CMS | Custom Operations Platform (e.g., MyPlanet Design) |
|---|---|---|
| Real-time event-driven updates | Requires custom plugins or middleware | Native WebSocket support |
| Time to first deployment | 2–4 weeks | 8–14 weeks |
| Domain-specific business logic | Manual configuration per workflow | Built into the application core |
| Concurrent ops users (20+) | Performance degrades under transactional load | Architected for high-concurrency use |
| Upfront investment | Lower (SaaS licensing model) | Higher (custom development) |
Five Modules Scoped for FreightHub Süd
The technical scope broke into five components:
- Real-time shipment tracking — WebSocket API replacing the polling approach that had introduced 45-second data lag across all three hubs
- Dispatcher task queue — priority rules engine sequencing assignments by delivery window, vehicle capacity, and client SLA tier
- Exception flagging — rule-based triggers surfacing anomalies like a shipment sitting idle 90+ minutes at an unscheduled stop
- Embedded reporting — Metabase-style analytics giving hub managers daily throughput and dispatcher utilization without exporting to Excel
- Role-based access control — three user tiers (dispatcher, hub manager, operations director) with scoped data visibility
Stack choices: React on the frontend, Python with FastAPI on the backend, PostgreSQL for persistence. FastAPI beat Django REST Framework on raw WebSocket throughput — a decision that saved roughly two weeks of optimization work later in the project. React won over Vue because the team, originally staffed from a CMS development agency that had pivoted into logistics tooling, already had component libraries from prior engagements, cutting UI development time by an estimated 20%.
The 20-User Inflection Point
One pattern we’ve observed across more than ten operations-heavy engagements: the moment a team exceeds 20 concurrent users on a shared spreadsheet workflow, a custom operations dashboard becomes ROI-positive within six months.
The math isn’t complicated. If each manual data-entry error costs €45 in correction time and downstream delay, and dispatchers average 12 errors daily across 40 users, that’s €540 per day — roughly €140,000 annually in preventable waste. A well-scoped operations platform eliminates 60–70% of those errors immediately. For teams weighing whether they’ve hit that threshold, understanding how to scope a custom web application for operations teams is the practical first move — whether you partner with a CMS development or build capabilities in-house.
MyPlanet Design delivered both the React frontend and the Python/FastAPI backend for this engagement with a single in-house team, eliminating the design-to-engineering handoff delays that a typical Development agency encounter adds — usually 3–5 weeks on comparable logistics platform builds.
From User Interviews to First Click: the Design Process That Made it Work

The dashboard that eventually cut dispatch ops time by 40% didn’t start with a wireframe. It started with a question: “Show me your screen at 9am on a typical Monday.”
Why the Research Phase Took Five Full Days
Twelve structured interviews — dispatchers, warehouse leads, regional managers — conducted over five working days. Not a survey. Not a requirements doc filtered through three layers of management. Face-to-face sessions where researchers watched people work and asked two questions that shaped everything that followed:
- “Walk me through the last time a shipment went wrong — what information did you need and where did you look for it?”
- “Show me your screen at 9am on a typical Monday.”
That first question exposed how dispatchers actually build situational awareness under pressure. The answer was remarkably consistent: they don’t trust any single system. When a shipment derails, they open SAP for order data, check the TMS for carrier status, pull up Excel for customer SLAs, and message a warehouse lead on Teams. Four tools, four context switches, zero unified view.
Monday mornings told an even sharper story. Dispatchers spent their first 20 minutes manually reconstructing overnight shipment status across three different screens before they could even begin route assignments. What does that cost across 42 dispatchers, five days a week?
Nielsen Norman Group research on enterprise dashboard design found that dashboards built without structured user research face a 58% higher redesign rate within 18 months. FreightHub Süd had already redesigned their legacy dispatcher interface twice in four years — both times without talking to actual dispatchers first.
Three Pain Points That Became Three Design Decisions
Affinity mapping the interview transcripts surfaced three patterns that directly shaped the information architecture:
- Split-screen context switching across four tools → The final dashboard consolidated shipment status, carrier data, and SLA timelines into a single-pane view with contextual side panels. No more toggling.
- Unclear ownership of flagged exceptions → Explicit exception assignment with named ownership badges and escalation timestamps. Every flagged shipment showed who owned it and when.
- No real-time ETA delta visibility → A dedicated ETA variance column displayed live deviations from planned delivery windows, color-coded by severity threshold.
Each pain point traced directly to a UI component. Nothing was added because it looked good in a demo.
Prototype Testing: from 47 Seconds to 19
Figma prototypes went through three rounds of testing with six real dispatchers — not stakeholders, not project sponsors, but the people who’d use this system eight hours a day. Four core workflows were measured each round: route assignment, exception triage, ETA override, and end-of-day reporting.
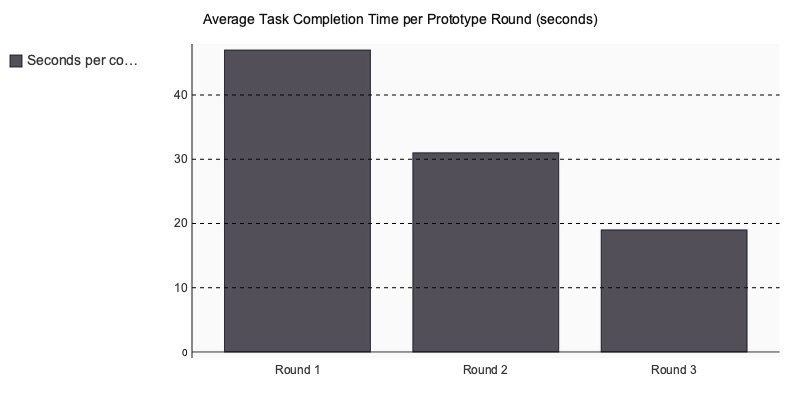
A 60% reduction in task completion time between round one and round three — and all of it happened before a single line of production code was written. Any CMS development worth hiring should be able to show you prototype testing data like this. If they can’t, the “design phase” is theater.
The Counterintuitive Finding: Less Data, Faster Decisions
Here’s where the project challenged a deeply held assumption in enterprise logistics tools. Initial wireframes packed maximum data density into every screen — the “control tower” approach that most ops platforms default to. More data points, more columns, more real-time feeds.
Dispatchers hated it.
User testing revealed they needed progressive disclosure — summary views with drill-down capability — not everything visible at once. When we stripped the default view down to five key metrics per shipment and moved detail into expandable panels, task completion time dropped by another eight seconds between rounds two and three. This directly contradicts the “data-rich dashboard” instinct that dominates logistics software design, and it’s a pattern we’ve seen repeatedly in enterprise UX research for operations teams. Most vendor demos in the logistics and supply chain space still default to the “show everything” philosophy, treating screen real estate like a warehouse floor — fill every square meter. Real dispatchers working real shifts need the opposite.
For teams evaluating whether their agency partner conducts structured research before touching design tools, exploring UX research methods for enterprise software projects is a useful benchmark to start from.
What Results Did the Development Agency Deliver After 6 Months?

Six months post-launch, FreightHub Süd’s dispatcher reconciliation time dropped by 40% — from 4.5 hours per shift to 2.7 hours. Shipment error rates fell from 12% to 3.8%, and the average exception handling response time collapsed from 24 hours to just 4.2 hours.
During structured follow-up interviews at three months, a senior dispatcher in the Hesse hub described the change concretely: “I used to spend the first hour of every shift figuring out which shipments needed my attention — now that’s visible the moment I log in. I actually start working immediately.”
That behavioral shift — dispatchers solving problems instead of hunting for them — drove the numbers more than any single technical feature.
Why Adoption Was the Real Benchmark
The standout metric wasn’t speed. It was stickiness. At six months, 94% of dispatchers used the platform daily without enforcement or mandates. According to Statista’s 2024 logistics software adoption report, custom-built operations tools achieve 2.3x higher user adoption at 12 months compared to off-the-shelf alternatives. FreightHub Süd hit near that ceiling in half the time.
Why? The research phase documented earlier wasn’t academic. When dispatchers see their exact Monday-morning workflow reflected in an interface, adoption isn’t a change-management problem — it’s recognition.
| Feature | Custom-Built Platform (MyPlanet Design) | Off-the-Shelf TMS |
|---|---|---|
| Workflow Fit | Tailored to existing dispatcher processes | Standardized templates |
| ERP/TMS Integration | Direct API connections | Connector-dependent |
| Deployment Timeline | 4–6 months | 2–4 weeks |
| Long-Term User Adoption | Typically 2.3x higher (Statista, 2024) | Industry baseline |
Off-the-shelf tools win on deployment speed. But when dispatcher efficiency determines margin — and for operators handling 500+ daily shipments, it does — the ROI math on a custom platform flips within the first year. For teams building an internal business case, frameworks for measuring ROI on custom software development projects provide a useful starting structure.
How to Choose a CMS Development That Delivers Measurable Outcomes

The difference between an agency that ships features and one that moves operational KPIs comes down to four questions you ask before signing. Each maps to a decision point from the FreightHub Süd engagement.
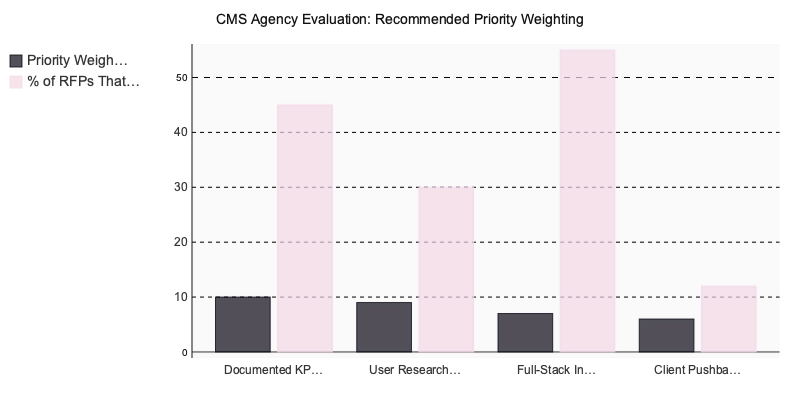
Four Criteria That Separate Outcome-Driven Agencies from Feature Factories
- Pre/post KPIs from a comparable engagement. Can they present a case study with baseline metrics and post-launch numbers for a client in your vertical? If the answer is a portfolio of screenshots, walk away.
- User research before architecture. Do they talk to your actual end users — dispatchers, warehouse staff, ops leads — before making technology decisions? FreightHub Süd proved that five days of structured interviews shaped every technical choice that followed.
- Full-stack ownership. Do they own design, frontend, backend, and DevOps in-house — or subcontract to separate vendors? Fragmented delivery chains create the exact integration gaps you’re hiring someone to eliminate.
- A recommendation they pushed back on. Ask them to describe a time they told a client “no.” Agencies that agree with everything optimize for contract renewal, not outcomes.
Three Red Flags to Surface Early
- They skip discovery and quote fixed-price before scoping your workflows.
- Their portfolio shows polished visuals but zero usage data or measurable outcomes.
- They can’t explain the data model behind a product they shipped.
Preparing a focused list of questions to ask a software development agency before signing sharpens these conversations. For enterprise buyers comparing shortlisted partners, a structured framework for evaluating a digital product agency adds the rigor that gut feel can’t.
For logistics, SaaS, or operations-intensive companies shortlisting a development partner in 2026, the FreightHub Süd results make the standard concrete: hold any agency to a research-first, KPI-anchored delivery process. The gap between a feature factory and a measurable 40% efficiency gain isn’t aspirational — it’s documented.
What FreightHub Süd’s Transformation Tells Us About Operational Software Done Right
The 40% reduction in dispatch ops time didn’t come from automation or AI. It came from watching twelve people do their jobs for five days and redesigning the screens they stared at for eight hours straight. That’s the part most teams skip.
Three patterns from this engagement apply broadly. First, the biggest efficiency gains hide in task-switching — not task execution. Second, user research with frontline operators reveals bottlenecks that no stakeholder interview captures. Third, a Development agency that measures success in operational KPIs rather than feature delivery will structure every sprint around outcomes, not output.
If your dispatchers, warehouse leads, or ops managers are still stitching together data from three or four disconnected tools, the math is straightforward: quantify the daily time lost, map the decision points that cause friction, and scope the build around those specific workflows.
For logistics teams ready to move from patchwork tools to a purpose-built operations layer, agencies like MyPlanet Design bring the cross-functional depth — research, design, engineering — to make that transition stick.
Written by Nazar Verhun, CEO & Lead Designer at MyPlanet Design.
Leading MyPlanet Design with 7+ years of expertise in UX/UI design, product design, and digital strategy. Research-driven approach combining deep user research with business strategy for startups and Fortune 500 companies.
Frequently Asked Questions
What does a CMS development agency do for logistics companies?
A CMS development agency builds custom content management systems tailored to logistics workflows, such as unified dispatcher dashboards, automated route assignment screens, and real-time exception tracking. They integrate fragmented data sources like ERP systems, tracking sheets, and transport management software into a single operational interface.
How can a CMS reduce operational time in freight dispatch?
A well-designed CMS eliminates the need for dispatchers to toggle between multiple disconnected systems by consolidating shipment data, driver availability, and exception alerts into one screen. This reduction in context-switching and manual data reconciliation can cut daily task time by 30-40% or more.
CMS development agency vs in-house development for logistics software
A specialized CMS development agency brings cross-industry workflow expertise and structured user research methodologies that most in-house teams lack. However, in-house teams offer deeper institutional knowledge. The best outcomes often come from agencies that embed with operational staff through shadowing and interviews rather than building from assumptions.
How long does a CMS implementation take for logistics operations?
A typical CMS implementation for mid-size logistics operations takes four to eight months, depending on the complexity of existing systems and the number of integration points. Projects structured around user research milestones rather than rigid feature sprints tend to deliver measurable ROI faster despite appearing slower at the start.
How much does a custom CMS cost for a logistics company?
Custom CMS development for logistics operations typically ranges from €50,000 to €250,000 depending on scope, number of integrations, and user base size. The investment is usually justified by operational time savings — even a 30-40% reduction in dispatcher task time translates to significant labor cost recovery within the first year.
What causes dispatcher inefficiency in freight logistics?
The primary cause of dispatcher inefficiency is fragmented tooling — operators often juggle between ERP systems, spreadsheets, email, and standalone transport management software with no unified view. This constant context-switching, combined with delayed exception visibility and manual data reconciliation, can waste several hours per shift on non-value-adding tasks.